

Verizon Stock Chart Provides Clear Range After Mixed Earnings
A number of stocks were hit by the glitch at the NYSE this morning, Verizon (VZ) among them.
It was among dozens of stocks that many investors consider blue-chip holdings. The interruption also affected a number of NYSE-listed stocks that reported earnings this morning.
Some of those are Johnson & Johnson (JNJ) , 3M (MMM) , Raytheon (RTX) and Union Pacific (UNP) .
For Verizon, the telecom-service provider reported in-line earnings and beat revenue estimates, while its outlook was a bit disappointing.
Despite the odd-looking charts, though, order seems to be restored.
Verizon will followed by rival AT&T (T) , which reports tomorrow before the open.
Trading Verizon Stock
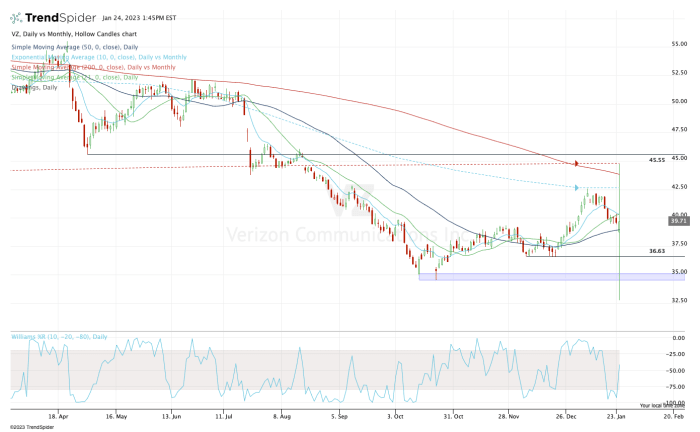
Daily chart of Verizon stock.
Chart courtesy of TrendSpider.com
Because of today’s volatility, we have to take Tuesday’s price action with a grain of salt. But it highlights some key areas on the upside and the downside.
On the upside, $42.50 and $45 are two key levels that the stock must reclaim in order to enjoy a sustained upside rally.
On the downside, $36.50 is vital for the bulls. A break of this level opens the door down to the $35 area, which was a double-bottom support area in October.
Verizon stock fell out of favor last summer and has been struggling to gain traction. Once viewed as a strong blue-chip holding with a big dividend yield, the stock has really disappointed investors.
That’s even as the shares trade at less than 10 times earnings and yield more than 6.5%.
For shorter-term investors, watch for a close over $40.75, which would propel the shares over the 10-day and 21-day moving averages and open the door back to the $42 to $42.50 area.
On the downside, a close below $38.75 puts Verizon stock below all its key daily moving averages and opens the door down to the aforementioned $36 zone.
We’ll see if AT&T’s report can cause the short-term range — $38.75 to $40.75 — to break and give us a bit more direction.
Related news on TheStreet


TheStreet Daily Newsletter
Want TheStreet’s best daily stock and investing news right in your inbox every weekday? Get our free flagship newsletter.
Sign Up Now