
iShares MBS ETF
Find Ratings Reports
MBB : NSD :
$89.73
 0.01 |
0.011146%
0.01 |
0.011146%
Today's Range:
89.67 -
89.8932
Avg. Daily Volume:
0
04/19/24 - 4:00 PM ET
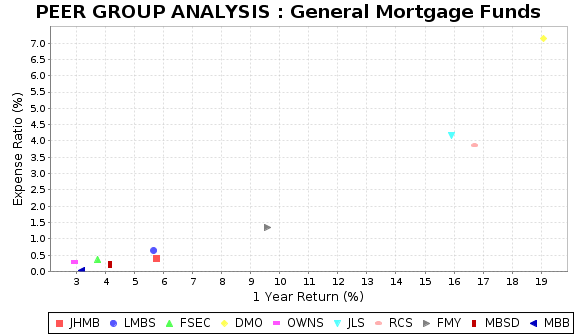
This chart compares MBB to the highest rated funds in its peer group of General Mortgage funds. The above graph illustrates two key measures that investors should consider when assessing the investment potential of a particular fund. One of the key factors is how the fund has performed over the most recent reporting period, defined as the 1 year total return on the bottom axis. The second factor is the fund's reported expense ratio, on the right axis, which includes things like management fees. The best funds, with higher returns and lower expenses, stake out a position in the lower left part of this graph.
TOP RATED FUNDS : General Mortgage | ||||||
|---|---|---|---|---|---|---|
| Name | Ticker | Return YTD | 1 Year Return |
3 Year Return | Expense Ratio | Peer Rank |
| John Hancock Mortgage Backed Sec | JHMB | -0.68 | 5.74 | 0.00 | 0.39 | 1 |
| First Trust Low Duration Opptys | LMBS | 0.52 | 5.66 | 0.84 | 0.64 | 2 |
| Fidelity Investment Grade Securtzd | FSEC | -1.34 | 3.74 | 0.00 | 0.36 | 3 |
| Western Asset Mortgage Opportunity | DMO | 5.13 | 19.08 | 3.64 | 7.14 | 4 |
| Impact Shares Affd Housing MBS | OWNS | -1.28 | 2.93 | 0.00 | 0.30 | 5 |
| Nuveen Mortgage and Income | JLS | 5.10 | 15.91 | 1.68 | 4.16 | 6 |
| PIMCO Strategic Income | RCS | 1.76 | 16.71 | 4.78 | 3.87 | 7 |
| First Trust Mortgage Income Fund | FMY | -2.94 | 9.56 | 0.85 | 1.36 | 8 |
| FlexShs Dscpld Duration MBS Index | MBSD | -0.60 | 4.17 | -2.60 | 0.20 | 9 |
| iShares MBS ETF | MBB | -1.52 | 3.16 | -3.32 | 0.03 | 13 |
| The above table compares the total return performance and expense ratio of iShares MBS ETF to the top rated funds within the General Mortgage peer group. iShares MBS ETF ranks number 13 out of 19 General Mortgage closed-end and exchange-traded funds that we rate. | ||||||