
Virtus Dividend Interest & Premium Strategy Fund of Beneficial Interest
Find Ratings Reports
NFJ : NYSE :
$11.83
 0.01 |
0.084602%
0.01 |
0.084602%
Today's Range:
11.815 -
11.91
Avg. Daily Volume:
0
04/19/24 - 4:05 AM ET
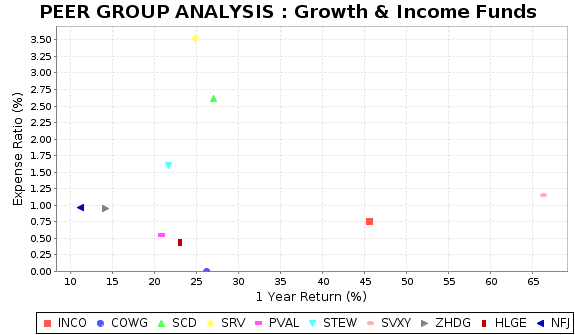
This chart compares NFJ to the highest rated funds in its peer group of Growth & Income funds. The above graph illustrates two key measures that investors should consider when assessing the investment potential of a particular fund. One of the key factors is how the fund has performed over the most recent reporting period, defined as the 1 year total return on the bottom axis. The second factor is the fund's reported expense ratio, on the right axis, which includes things like management fees. The best funds, with higher returns and lower expenses, stake out a position in the lower left part of this graph.
TOP RATED FUNDS : Growth & Income | ||||||
|---|---|---|---|---|---|---|
| Name | Ticker | Return YTD | 1 Year Return |
3 Year Return | Expense Ratio | Peer Rank |
| Columbia India Consumer | INCO | 8.35 | 45.64 | 14.70 | 0.75 | 1 |
| Pacer US Lg Cap Csh Cws Grwth Ldrs | COWG | 7.97 | 26.27 | 0.00 | 0.00 | 2 |
| LMP Capital and Income Fund Inc | SCD | 3.57 | 27.06 | 14.81 | 2.62 | 3 |
| NXG Cushing Midstream Energy | SRV | 13.16 | 24.85 | 27.09 | 3.52 | 4 |
| Putnam Focused Large Cap Value | PVAL | 7.13 | 20.92 | 0.00 | 0.55 | 5 |
| SRH Total Return | STEW | 7.89 | 21.75 | 10.91 | 1.60 | 6 |
| ProShares Short VIX Sh Tm Fut ETF | SVXY | 6.66 | 66.30 | 38.74 | 1.15 | 7 |
| ZEGA Buy and Hedge | ZHDG | 4.34 | 14.27 | 0.00 | 0.95 | 8 |
| Hartford Longevity Economy | HLGE | 8.22 | 23.06 | 0.00 | 0.44 | 9 |
| Virtus Div Int and Prem Str | NFJ | -1.67 | 11.20 | 4.55 | 0.96 | 75 |
| The above table compares the total return performance and expense ratio of Virtus Div Int and Prem Str to the top rated funds within the Growth & Income peer group. Virtus Div Int and Prem Str ranks number 75 out of 161 Growth & Income closed-end and exchange-traded funds that we rate. | ||||||