
iShares Core MSCI International Developed Markets ETF
Find Ratings Reports
IDEV : ARCA :
$65.3
 -0.2 |
-0.305344%
-0.2 |
-0.305344%
-0.2 |
-0.305344%
Today's Range:
65.05 -
65.53
Avg. Daily Volume:
0
04/25/24 - 2:22 AM ET
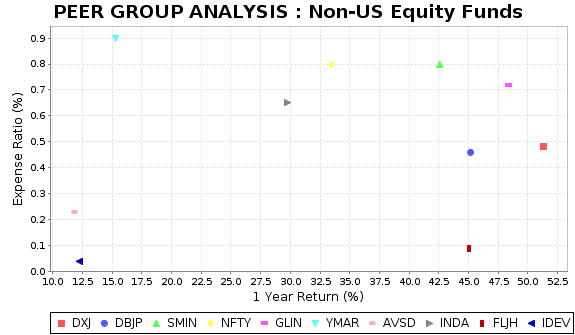
This chart compares IDEV to the highest rated funds in its peer group of Non-US Equity funds. The above graph illustrates two key measures that investors should consider when assessing the investment potential of a particular fund. One of the key factors is how the fund has performed over the most recent reporting period, defined as the 1 year total return on the bottom axis. The second factor is the fund's reported expense ratio, on the right axis, which includes things like management fees. The best funds, with higher returns and lower expenses, stake out a position in the lower left part of this graph.
TOP RATED FUNDS : Non-US Equity | ||||||
|---|---|---|---|---|---|---|
| Name | Ticker | Return YTD | 1 Year Return |
3 Year Return | Expense Ratio | Peer Rank |
| WisdomTree Japan Hedged Equity | DXJ | 19.42 | 51.31 | 24.96 | 0.48 | 1 |
| Xtrackers MSCI Jp Hdg Eq | DBJP | 17.44 | 45.17 | 17.95 | 0.46 | 2 |
| iShares MSCI India Small Cap | SMIN | 5.34 | 42.59 | 14.63 | 0.80 | 3 |
| First Trust India NIFTY 50 Eq Wght | NFTY | 6.07 | 33.44 | 12.16 | 0.80 | 4 |
| VanEck India Growth Leaders | GLIN | 9.36 | 48.36 | 13.92 | 0.72 | 5 |
| FT Vest Intl Equity Buffer Mar | YMAR | 2.94 | 15.31 | 0.00 | 0.90 | 6 |
| Avantis Responsible Intl Equity | AVSD | 2.79 | 11.82 | 0.00 | 0.23 | 7 |
| iShares MSCI India ETF | INDA | 6.37 | 29.75 | 9.24 | 0.65 | 8 |
| Franklin FTSE Japan Hedged | FLJH | 16.75 | 45.01 | 18.15 | 0.09 | 9 |
| iShares Core MSCI Internatl Dev Mkt | IDEV | 2.92 | 12.21 | 4.11 | 0.04 | 122 |
| The above table compares the total return performance and expense ratio of iShares Core MSCI Internatl Dev Mkt to the top rated funds within the Non-US Equity peer group. iShares Core MSCI Internatl Dev Mkt ranks number 122 out of 330 Non-US Equity closed-end and exchange-traded funds that we rate. | ||||||