
abrdn Life Sciences Investors Shares of Beneficial Interest
Find Ratings Reports
HQL : NYSE :
$13.15
 0.16 |
1.231717%
0.16 |
1.231717%
Today's Range:
12.94 -
13.18
Avg. Daily Volume:
0
04/23/24 - 10:22 PM ET
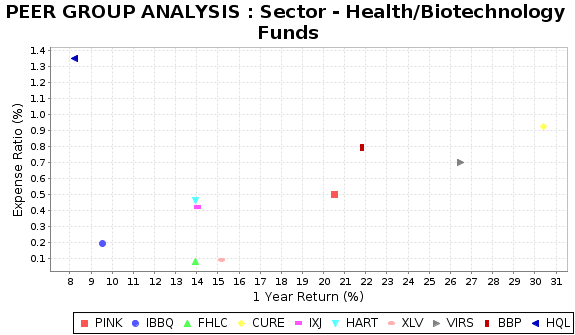
This chart compares HQL to the highest rated funds in its peer group of Sector - Health/Biotechnology funds. The above graph illustrates two key measures that investors should consider when assessing the investment potential of a particular fund. One of the key factors is how the fund has performed over the most recent reporting period, defined as the 1 year total return on the bottom axis. The second factor is the fund's reported expense ratio, on the right axis, which includes things like management fees. The best funds, with higher returns and lower expenses, stake out a position in the lower left part of this graph.
TOP RATED FUNDS : Sector - Health/Biotechnology | ||||||
|---|---|---|---|---|---|---|
| Name | Ticker | Return YTD | 1 Year Return |
3 Year Return | Expense Ratio | Peer Rank |
| Simplify Health Care | PINK | 10.31 | 20.54 | 0.00 | 0.50 | 1 |
| Invesco Nasdaq Biotechnology | IBBQ | 3.38 | 9.53 | 0.00 | 0.19 | 2 |
| Fidelity MSCI Health Care Index ETF | FHLC | 7.02 | 13.93 | 7.90 | 0.08 | 3 |
| Direxion Daily Healthcare Bull 3X | CURE | 20.28 | 30.41 | 18.78 | 0.92 | 4 |
| iShares Global Healthcare | IXJ | 6.07 | 14.04 | 8.62 | 0.42 | 5 |
| IQ Healthy Hearts | HART | 2.99 | 13.95 | 7.42 | 0.46 | 6 |
| Health Care Select Sector SPDR | XLV | 7.30 | 15.18 | 10.69 | 0.09 | 7 |
| Pacer BioThreat Strategy | VIRS | 9.93 | 26.49 | 9.83 | 0.70 | 8 |
| Virtus LifeSci Biotech Prod | BBP | 4.38 | 21.80 | 4.25 | 0.79 | 9 |
| Tekla Life Sciences Investors | HQL | 6.44 | 8.21 | -2.49 | 1.35 | 21 |
| The above table compares the total return performance and expense ratio of Tekla Life Sciences Investors to the top rated funds within the Sector - Health/Biotechnology peer group. Tekla Life Sciences Investors ranks number 21 out of 48 Sector - Health/Biotechnology closed-end and exchange-traded funds that we rate. | ||||||