
iShares MSCI Emerging Markets ETF
Find Ratings Reports
EEM : ARCA :
$40.61
0.0 |
0.0%
Today's Range:
-
Avg. Daily Volume:
0
04/25/24 - 9:29 AM ET
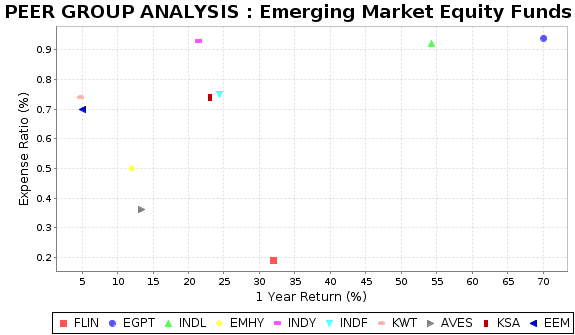
This chart compares EEM to the highest rated funds in its peer group of Emerging Market Equity funds. The above graph illustrates two key measures that investors should consider when assessing the investment potential of a particular fund. One of the key factors is how the fund has performed over the most recent reporting period, defined as the 1 year total return on the bottom axis. The second factor is the fund's reported expense ratio, on the right axis, which includes things like management fees. The best funds, with higher returns and lower expenses, stake out a position in the lower left part of this graph.
TOP RATED FUNDS : Emerging Market Equity | ||||||
|---|---|---|---|---|---|---|
| Name | Ticker | Return YTD | 1 Year Return |
3 Year Return | Expense Ratio | Peer Rank |
| Franklin FTSE India | FLIN | 6.16 | 32.00 | 10.83 | 0.19 | 1 |
| VanEck Egypt Index | EGPT | 21.58 | 70.10 | 6.71 | 0.94 | 2 |
| Direxion Daily MSCI India Bull 2X | INDL | 11.16 | 54.27 | 10.90 | 0.92 | 3 |
| iShares JP Morgan EM High Yield Bd | EMHY | 2.50 | 12.02 | 0.00 | 0.50 | 4 |
| iShares India 50 ETF | INDY | 3.49 | 21.47 | 7.70 | 0.93 | 5 |
| Nifty India Financials | INDF | 1.17 | 24.30 | 6.15 | 0.75 | 6 |
| iShares MSCI Kuwait | KWT | 10.03 | 4.72 | 11.82 | 0.74 | 7 |
| Avantis Emerging Markets Value | AVES | 2.86 | 13.34 | 0.00 | 0.36 | 8 |
| iShares MSCI Saudi Arabia | KSA | 5.88 | 23.03 | 12.57 | 0.74 | 9 |
| iShares MSCI Emerging Markets | EEM | 0.67 | 5.10 | -6.92 | 0.70 | 79 |
| The above table compares the total return performance and expense ratio of iShares MSCI Emerging Markets to the top rated funds within the Emerging Market Equity peer group. iShares MSCI Emerging Markets ranks number 79 out of 104 Emerging Market Equity closed-end and exchange-traded funds that we rate. | ||||||