
iShares 7-10 Year Treasury Bond ETF
Find Ratings Reports
IEF : NSD :
$91.59
 -0.28 |
-0.304778%
-0.28 |
-0.304778%
-0.28 |
-0.304778%
Today's Range:
91.435 -
91.6879
Avg. Daily Volume:
0
04/24/24 - 4:00 PM ET
| RETURN AND EXPENSE COMPARISON (as of Jan 2024) | |||
|---|---|---|---|
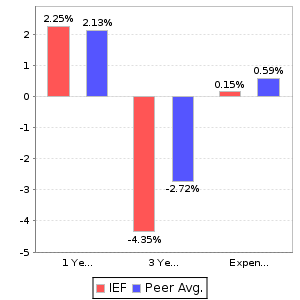 | |||
| 1 Month: | -0.95% | 1 Year: | 2.25% |
| 3 Month: | 1.19% | 3 Year: | -4.35% |
| 6 Month: | 2.07% | 5 Year; | -0.34% |
| Year-to-Date | -1.56% | ||
| Last Dividend (03/01/2024) |
$0.25 | ||
| Last Cap Gain | 0.51 | ||
| Expense Ratio | 0.15% | ||
| MOST RECENT RATINGS CHANGES | ||||
|---|---|---|---|---|
| Date | Price | Action | From | To |
| 02/28/2023 | $95.76 | Downgrade | HOLD | SELL |
| 04/30/2022 | $102.81 | Upgrade | SELL | HOLD |
| 03/31/2022 | $107.47 | Downgrade | HOLD | SELL |
| RETURN AND VOLATILITY MEASURES | ||
|---|---|---|
| 1 Year | 3 Year | |
| Alpha | -0.04% | -0.91% |
| Beta | 0.48% | 0.51% |
| R-squared | 90.0% | 89.0% |
| Standard Deviation | 8.49% | 8.48% |
| Semi-deviation | 1.86% | 2.17% |
|
Definitions: Alpha - measures the portfolio manager's contribution to performance that is independent of the benchmark. Beta - measures the portfolio sensitivity to movements in the market relative to the selected underlying benchmark. R-squared - mesausres how closely the derived forecast was able to explain the performance of the last three years. It also measures diversification with lower number indicating more independence from benchmark. Standard deviation - measures how closely actual values matched the forecasted values for performance. Semi-deviation - only considers values that fall below the risk free rate of return. | ||